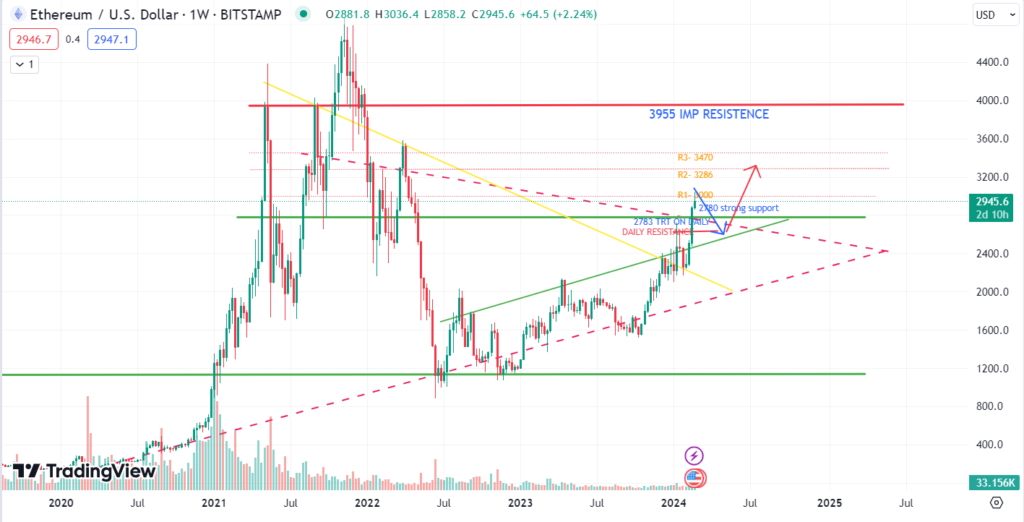
Ethereum, the cryptocurrency powering decentralized finance (DeFi), non-fungible tokens (NFTs), and smart contracts, sits at $2954, a testament to its strength. But understanding its price journey requires exploring key support and resistance levels.

Strong Foundations:
Think of $2780 as Ethereum’s safety net. This “support level” acts like a barrier against price drops, offering reassurance to investors. But if it breaks, it could signal a shift in market sentiment.
Psychological Hurdles:
Next comes the $3000 barrier, not just a price point, but a psychological hurdle. Crossing it signifies renewed bullishness, but it’s not easy to break through.
Beyond the First Gate:
Even if Ethereum conquers $3000, challenges await. Resistance levels at $3286 and $3470 could slow its climb, acting like speed bumps on the road to higher prices.
Downward Dips:
If Ethereum stumbles, it might retrace to $2575, offering a potential buying opportunity for those waiting to jump in.

Ethereum’s current price levels, support and resistance levels, and potential retracement offer valuable insights for investors and traders. By understanding these dynamics and staying informed about market developments, individuals can make informed decisions and capitalize on opportunities in the dynamic cryptocurrency market. As Ethereum continues to evolve and mature, its significance in the broader digital economy is likely to grow, positioning it as a key player in the future of finance and technology.
Staking, Storage, and Swaps: 8 Altcoins Shaping the Future of Decentralized Finance and Beyond
Kava: A decentralized finance (DeFi) platform focused on secure lending and borrowing.
Waves: A blockchain platform with a focus on ease of use and scalability.
Lido: A liquid staking solution for Ethereum, allowing users to earn rewards on their staked ETH.
Mana: The native token of Decentraland, a virtual reality platform.
dYdX: A decentralized exchange for margin trading and lending.
INJ: The native token of Injective Protocol, a decentralized exchange for derivatives trading.
Storj: A decentralized cloud storage platform.
Ripple (XRP) Analysis: Potential Breakout on the Horizon
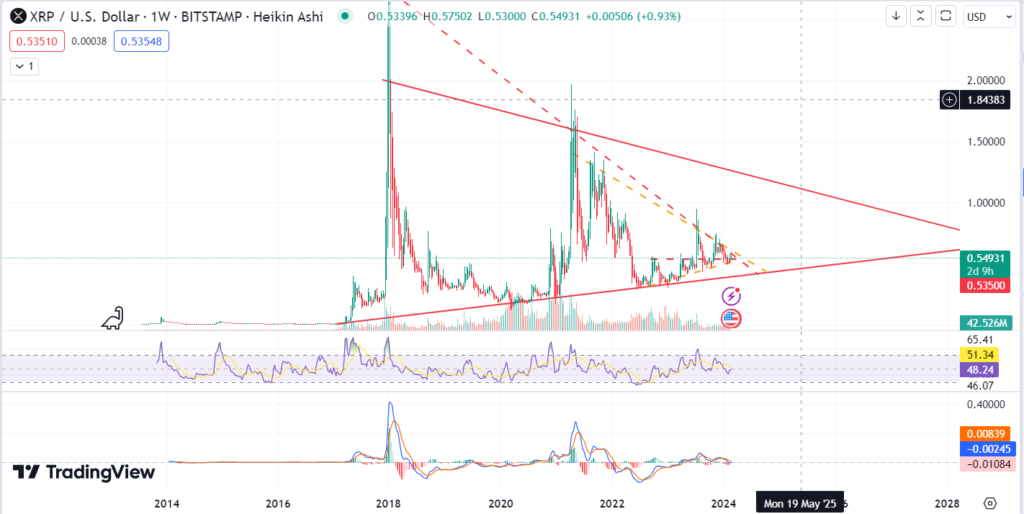
Ripple (XRP), a digital currency known for its fast and low-cost transactions, has been garnering attention in the cryptocurrency market. With its current price hovering around $0.53514 USD, investors are eyeing potential breakout levels and analyzing key indicators for insights into future price movements.
Breakout Potential Near $0.60 USD:
One significant price level to watch for Ripple (XRP) is the potential breakout point near $0.60 USD. This level represents a psychological barrier and could trigger renewed buying interest if breached. A breakout above $0.60 USD could pave the way for further upside momentum, attracting more investors and potentially driving Ripple’s price higher.


Symmetrical Triangle Formation on Weekly Chart:
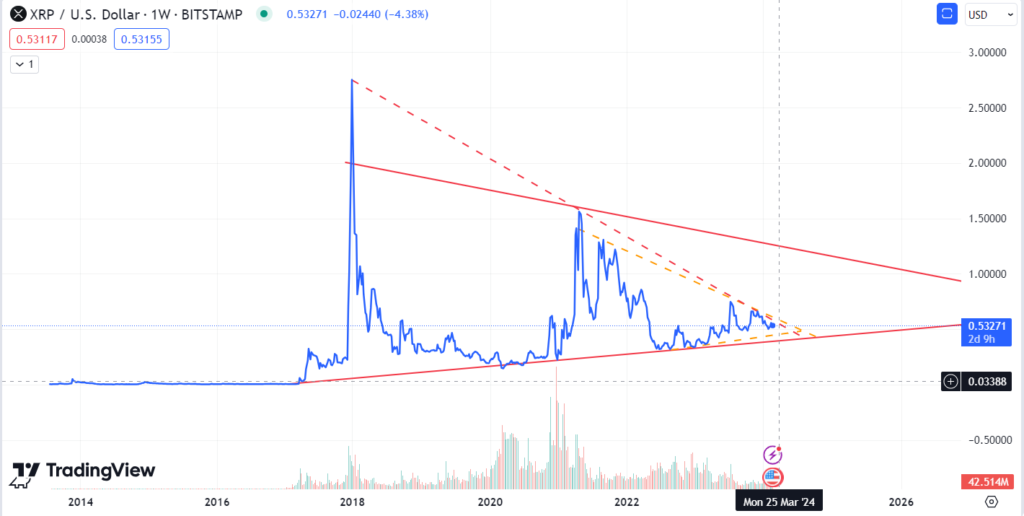
Analyzing the weekly chart reveals the formation of a symmetrical triangle pattern. This pattern typically indicates a period of consolidation and indecision in the market, with prices forming higher lows and lower highs. As the pattern narrows towards the apex, it sets the stage for a significant breakout or breakdown.
In the case of Ripple (XRP), the symmetrical triangle pattern suggests the potential for a big breakout to $1 USD or higher. This breakout could occur if Ripple’s price decisively moves above the upper trendline of the triangle, signaling a shift in momentum and a resumption of the uptrend.
Daily Chart Analysis:
Zooming into the daily chart, we can gain further insights into Ripple’s short-term price dynamics. According to the Moving Average Convergence Divergence (MACD) and Relative Strength Index (RSI) indicators, both suggest a small retracement may be on the horizon.
The MACD indicator measures the strength and direction of a trend, while the RSI indicates whether a cryptocurrency is overbought or oversold. In the case of Ripple (XRP), both indicators are signaling a potential retracement to around $0.51150 USD. However, this retracement is expected to be temporary, with a reversal likely to occur towards the resistance level at $0.57362 USD.
Ripple (XRP) is poised for potential price movements in the near future, with breakout levels and key indicators signaling possible opportunities for investors. The breakout potential near $0.60 USD and the formation of a symmetrical triangle on the weekly chart suggest a significant move may be imminent.
While short-term retracements are possible, the overall outlook for Ripple (XRP) remains positive, driven by factors such as its utility in cross-border payments and increasing adoption by financial institutions. As always, investors should conduct their own research and consider their risk tolerance before making any investment decisions in the cryptocurrency market.
