After enduring a lengthy consolidation phase exceeding two years, XRP, the native token of Ripple, appears poised for a significant price breakout. This article explores the technical indicators and market sentiment hinting at a potential surge in XRP’s value, potentially bringing good news to long-term holders (HODLers).
Weekly Chart Analysis of XRP: Symmetrical Triangle Hints at Breakout
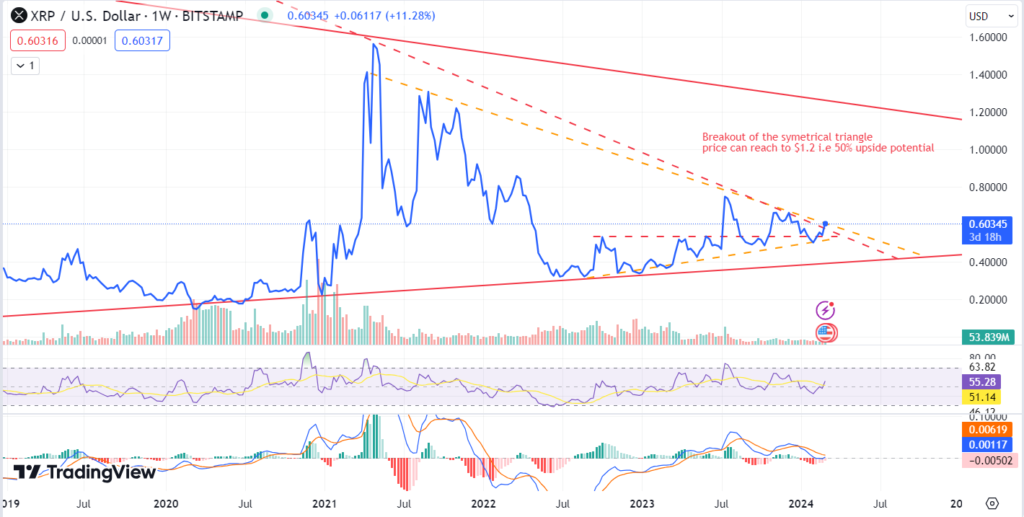
A crucial indicator on the weekly chart is the symmetrical triangle pattern. This pattern often precedes a breakout, signaling a potential shift in momentum. XRP’s current price of $0.60670 USD sits near the upper trendline of the triangle, suggesting an imminent breakout towards the upside.

If a breakout occurs, Ripple price could face resistance at several key levels before reaching new highs. The first hurdle lies at $0.70, followed by $0.80, $1.00, and $1.20. These resistance levels could be broken gradually, one after another, in a “phased” manner. This scenario suggests a sustained bull run rather than a sudden, unsustainable spike.
Beyond the price chart, technical indicators also paint a bullish picture. The Relative Strength Index (RSI), which measures momentum, is currently hovering around 50, indicating a neutral zone. However, a break above 50 could signal increasing buying pressure and support a potential price rise.
The Moving Average Convergence Divergence (MACD), another indicator of momentum and trend direction, is also hinting at a potential bullish crossover. A crossover signifies a shift in momentum towards the upside, further strengthening the case for a breakout. With a potential breakout from the symmetrical triangle looming, bullish technical indicators, and a cautiously optimistic market sentiment, XRP could be on the cusp of a significant price surge.
Stellar: Bridging the Gap in Global Payments
Imagine a world where transferring money across borders is as seamless as sending a text message. This is the vision behind Stellar, a blockchain-powered network designed to revolutionize global payments and asset exchange.
From Ripple to Lumens:
Stellar’s origin story is intertwined with Ripple, another prominent blockchain player. Founded in 2014 by Jed McCaleb and Joyce Kim, Stellar emerged from a desire to create a more accessible and lower-cost alternative following internal disagreements within Ripple’s leadership.
At the heart of Stellar lies the Stellar Lumen (XLM), the network’s native token. It serves two vital functions:
- Transaction Fee: XLM acts as a gateway to prevent spam by requiring a small transaction fee, ensuring the network remains efficient and secure.
- Liquidity Bridge: XLM acts as a bridge currency, fostering smooth exchanges between any asset issued on the network by trusted entities called “anchors.” These anchors, often financial institutions, can include banks, money transfer services, or even individual individuals who have earned the network’s trust.

One of Stellar’s unique features is its Stellar Consensus Protocol (SCP), implemented in 2015. This innovative system abandons the energy-intensive proof-of-work model used by some blockchains. Instead, it relies on a federated Byzantine Agreement (FBA) approach.
Think of it like a group discussion where participants need to reach a consensus. In Stellar’s case, trusted “quorums” of peers within the network verify transactions, building trust and scaling efficiently across the entire network.
With its innovative approach to fees, liquidity, and consensus, Stellar is striving to bridge the gap in global financial services, making them faster, cheaper, and more accessible for everyone, from individuals to major institutions. As the network continues to evolve, one thing remains certain: Stellar’s potential to transform the way we transact on a global scale is undeniable.
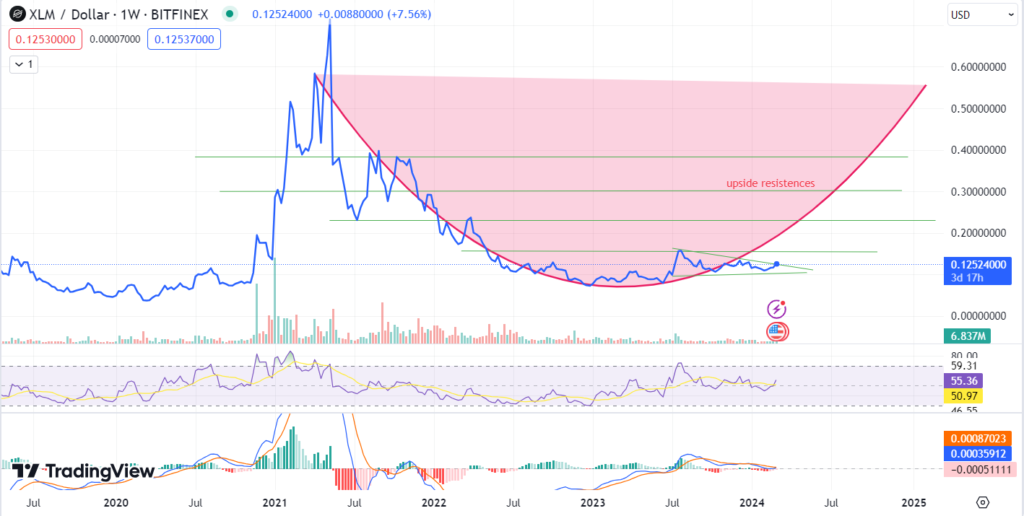
NOTE : Rounding Bottom: A Sign of Potential Reversal?
The rounding bottom, resembling a saucer or bowl, is a technical chart pattern suggesting a potential reversal from a downtrend to an uptrend. It forms when the price dips, creates a rounded bottom, and then rises, exceeding the previous peak.
Key points:
- Shape: Resembles a “U” or a bowl.
- Context: Often appears after a downtrend.
- Significance: Suggests a potential trend reversal towards an uptrend.
- Confirmation: A breakout above the formation’s neckline is crucial for confirmation.
